Simulate datasets with condition effect
Introduction
In this example, we will show how to use scDesign3Py to simulate data with condition effects and how to adjust the condition effects.
Import packages and Read in data
import pacakges
import copy
import anndata as ad
import numpy as np
import scDesign3Py
Read in data
The raw data is from the SeuratData package. The data is called ifnb in the package; it is PBMC data simulated and controlled by IFNB. The raw data is converted to .h5ad file using the R package sceasy.
To save time, we only choose the top 30 genes and two cell types (CD14 Mono and B).
data = ad.read_h5ad("data/IFNB.h5ad")
data = data[(data.obs["cell_type"] == "CD14 Mono") | (data.obs["cell_type"] == "B"), 0:30]
data.layers["log"] = np.log1p(data.X)
data
AnnData object with n_obs × n_vars = 5340 × 30
    obs: 'orig.ident', 'nCount_RNA', 'nFeature_RNA', 'stim', 'seurat_annotations', 'ident', 'cell_type', 'condition'
    var: 'name'
    layers: 'log'
The condition information is stored in obs property of the example dataset.
data.obs["condition"].head()
AAACATACATTTCC.1    CTRL
AAACATACCAGAAA.1    CTRL
AAACATACCTCGCT.1    CTRL
AAACATACGGCATT.1    CTRL
AAACATTGCTTCGC.1    CTRL
Name: condition, dtype: category
Categories (2, object): ['CTRL', 'STIM']
Simulation
First, we will simulate new data with the condition effects.
test = scDesign3Py.scDesign3(n_cores=3,parallelization="pbmcmapply")
test.set_r_random_seed(123)
simu_res = test.scdesign3(
    anndata=data,
    default_assay_name="counts",
    celltype="cell_type",
    other_covariates="condition",
    mu_formula="cell_type + condition + cell_type*condition",
    sigma_formula="1",
    family_use="nb",
    usebam=False,
    corr_formula="cell_type",
    copula="gaussian",
)
ifnb_newcount = simu_res["new_count"]
Then, we can also simulate a new dataset with condition effects on B cells removed.
# create instance
ifnb = scDesign3Py.scDesign3(n_cores=3,parallelization="pbmcmapply")
# construct data
ifnb_data = ifnb.construct_data(
    anndata=data,
    default_assay_name="counts",
    celltype = "cell_type",
    other_covariates = "condition",
    corr_formula = "cell_type"
)
# fit marginal
ifnb_marginal = ifnb.fit_marginal(
    mu_formula="cell_type + condition + cell_type*condition",
    sigma_formula="1",
    family_use="nb",
    usebam=False,
    n_cores=2
)
# fit copula
ifnb.set_r_random_seed(123)
ifnb_copula = ifnb.fit_copula()
In here, the condition effects on B cells are removed for all genes by modifying the estimated coefficients for all genes’ marginal models.
ifnb_marginal_null_B = copy.deepcopy(ifnb_marginal)
for k, _ in ifnb_marginal.items():
    ifnb_marginal.rx2(k).rx2("fit").rx2("coefficients")[-1] = 0 - ifnb_marginal.rx2(k).rx2(
        "fit"
    ).rx2("coefficients")[-2]
Then, we can generate the parameters using the altered marginal fits and simulate new data with the altered paremeters.
ifnb_para_null_B = ifnb.extract_para(
    marginal_dict=ifnb_marginal_null_B,
    family_use="nb",
    n_cores=2
)
ifnb.set_r_random_seed(123)
ifnb_newcount_null_B = ifnb.simu_new(n_cores=1)
We then create the corresponding anndata.AnnData object.
simu_anndata_list = []
for count_mat in [ifnb_newcount, ifnb_newcount_null_B]:
    tmp = ad.AnnData(X=count_mat, obs=ifnb_data["newCovariate"])
    tmp.layers["log"] = np.log1p(tmp.X)
    simu_anndata_list.append(tmp)
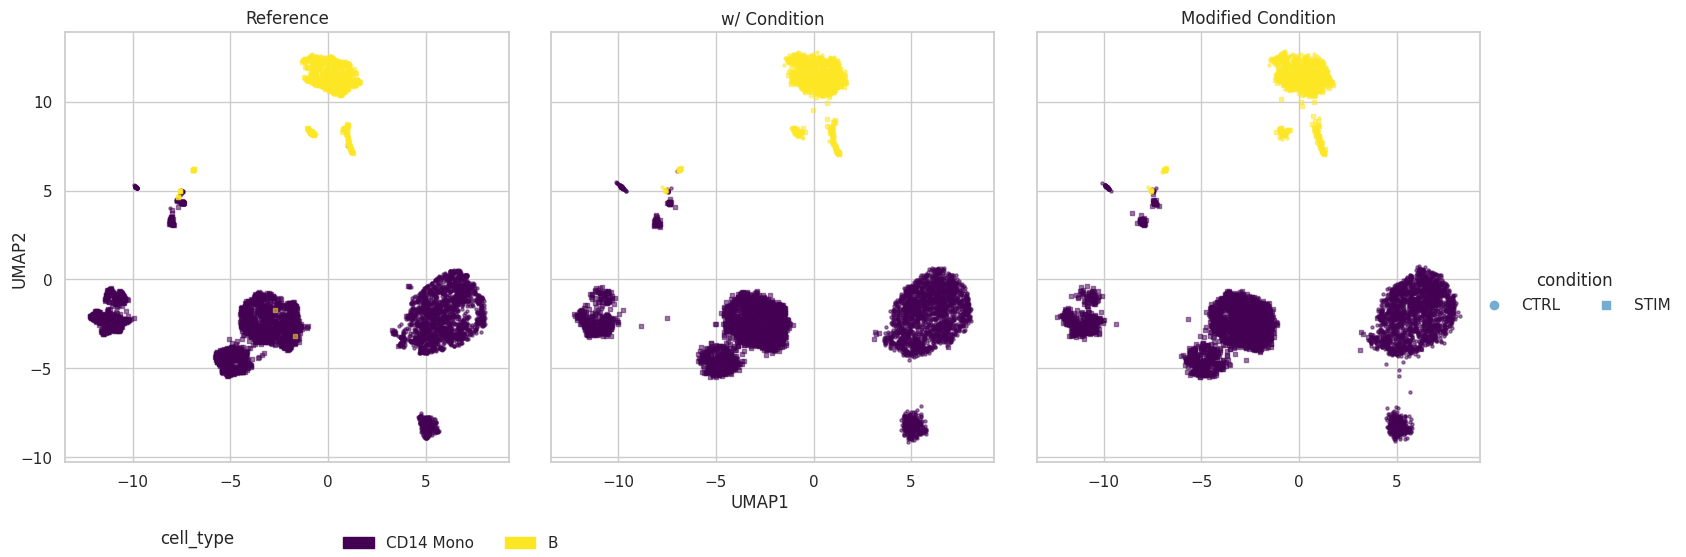
Visulization
plot = scDesign3Py.plot_reduceddim(
    ref_anndata=data,
    anndata_list=simu_anndata_list,
    name_list=["Reference", "w/ Condition", "Modified Condition"],
    assay_use="log",
    color_by="cell_type",
    shape_by="condition",
    n_pc=20,
    point_size=5,
)
UMAP
plot["p_umap"]